
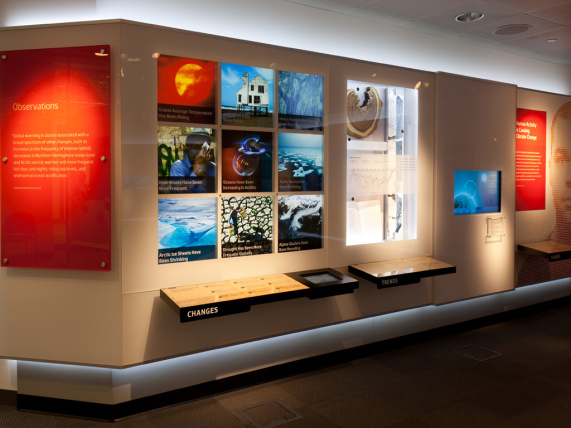


Observations
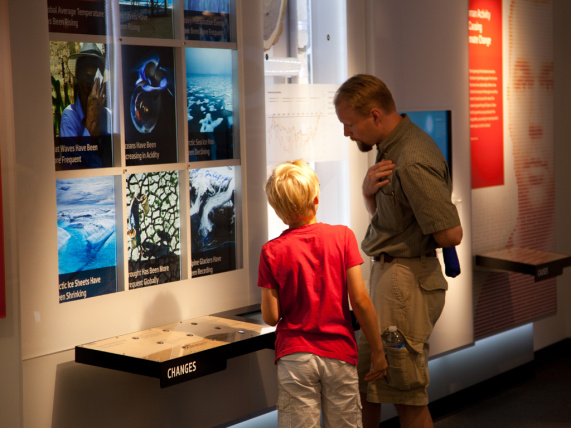
Weaving photography, artifacts, data visualizations, and interactive media, this section of the Earth Lab exhibit articulates the evidence of climate change and the role human activity is playing in its escalation.
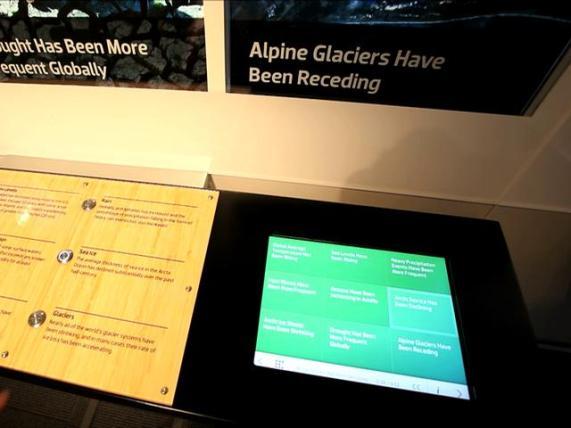
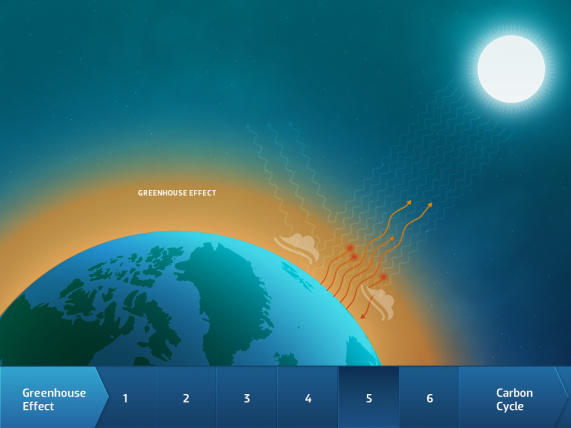
The first display states the facts of climate change, such as receding glaciers and heat waves, and then enhances these statements with an interactive featuring slideshows and NASA visualizations. In the next area, physical artifacts introduce the key evidence scientists use to reconstruct temperature data; weather logs, ice cores, and tree rings are on display as historic indicators that inform us of what the climate was like in the distant past. In contrast to the physical objects, an interactive beautifully animates the basic principles of earth science that dictate climate change.
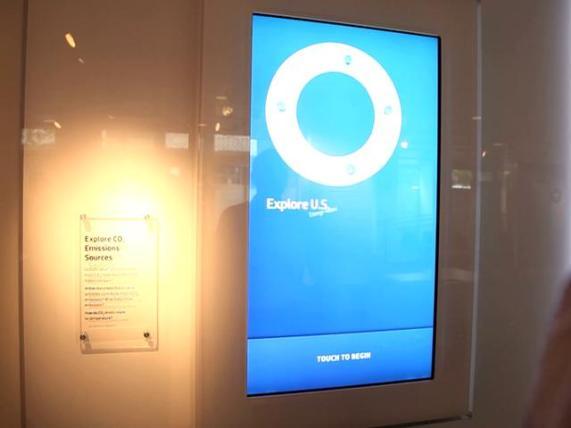
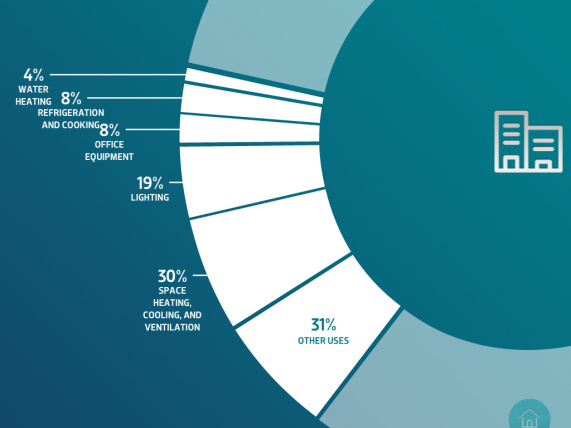
The interactive capstone to this section of the gallery, the Observations Explorer, peels back the layers behind global greenhouse emissions and those responsible. It is a bold data visualization that brings life and clarity to otherwise dense information. A timeline allows visitors to zero in on the global contributors to greenhouse gas emissions and compare which nations have had the greatest carbon footprint over the past thirty years. An innovative circular data visualization specifically deconstructs U.S. emissions, providing a window into the gritty details behind emissions in the industrial and residential sectors.